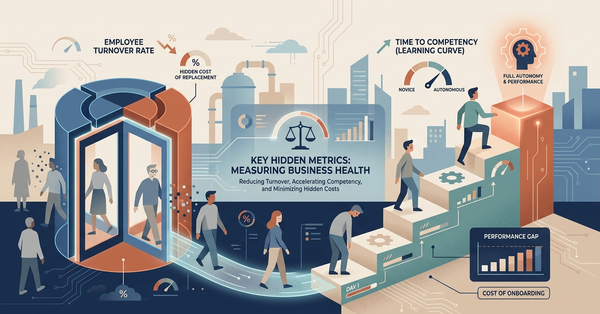
Two Numbers Almost Nobody Watches
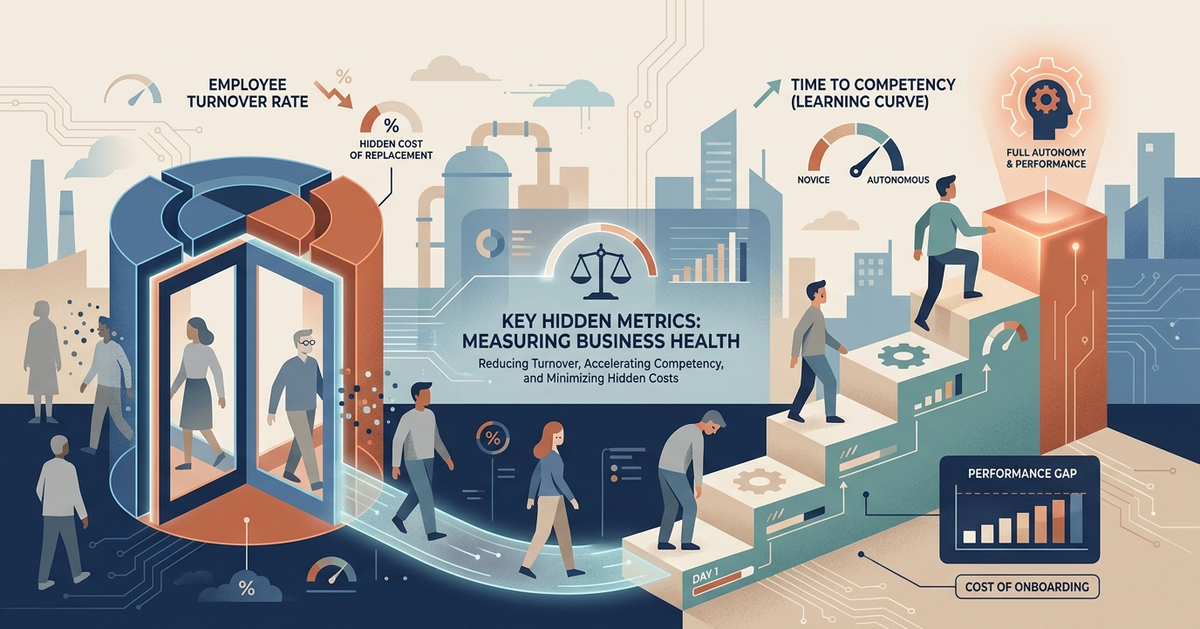
Employee turnover and Time to Competency explain each other. Looking at them separately is the most common way to underestimate both.
Try this at your next leadership meeting. Ask what last year’s turnover rate was in the operation’s critical roles.
Most likely there will be a short silence, followed by one of three answers: “low,” “normal for the industry,” or “HR has that.” A number rarely shows up.
Now ask a second question: how long does it take a new operator, from their first day, to work to the standard of the role without someone having to watch over them?
That question almost never gets an answer. Not because the information doesn’t exist, but because very few organizations have built it into their management as a KPI that carries real weight.
These are two metrics that get overlooked far too often, and the problem isn’t just that they go unmeasured. It’s that, when you look at them together, they tell a much more expensive story than either one tells on its own.
Two metrics, two definitions
Turnover rate is the share of people who leave the organization during a period, relative to the average headcount for that period:
Annual turnover rate = (departures in the year ÷ average headcount for the year) × 100
If a mine site averaged 200 operators over the year and 36 left, its annual turnover in that role was 18%.
That number, on its own, says little. It becomes useful when you break it into three:
- Voluntary and involuntary. A resignation is not the same as a termination. The first tells you about what the organization offers; the second, often, about how it hired.
- By role and by area. An overall turnover rate of 10% can hide, for example, 30% among the maintenance technicians on one particular shift.
- Early. Departures that happen before 12 months, and especially before 90 days, are the most revealing, because the organization paid the full cost of bringing the person on board and got almost nothing back.
Time to Competency (TTC) is the time between a person’s start date and the moment they meet the standard of their role on their own.
It shouldn’t be confused with time to hire or time to fill. Those measure how long it takes for someone to arrive. TTC measures how long it takes that someone to perform.
And here is the first finding, which tends to make people uncomfortable: many organizations can’t measure their TTC because they never wrote down what “competent” means in that role. There’s an onboarding program, there’s equipment certification, there’s the supervisor’s sign-off. But there’s no observable standard that says when the person is actually ready. Without a standard, there’s no arrival date, and without an arrival date, there’s no metric.
A reference point
It’s easier to ask others to measure when you put a number on the table yourself.
In the mining services operations I led, annual staff turnover stayed below 5%. I don’t present that as an industry standard or a universal target: it’s one experience, in one context, at one point in time. But it’s useful for something very concrete: comparison.
I invite you to run the exercise on your own operation. Calculate your rate with the formula above, for the last 12 months and for a comparable population: the people who work in the operation, not the company’s total headcount. If you’re close to that 5%, good. If you’re several times above it, the useful question isn’t “is that a lot?” but “which roles is it concentrated in, and how many of those people left before they reached the standard?”
For the comparison to be fair, you have to measure the same thing. Including or excluding terminations, contractors, or fixed-term contracts changes the result considerably. What matters is that everyone knows what they’re measuring and, above all, that they have a number.
What a departure costs, and what never shows up in the math
When someone tries to put a number on the cost of turnover, they usually add up what’s visible: severance, job postings, recruiting hours, pre-employment medical exams, onboarding, and certification courses.
Research shows that this calculation falls short, and by a wide margin. A Center for American Progress review of 30 case studies from 11 research papers found that the typical cost of replacing an employee, the median, is about 21% of their annual pay, with a range from 5.8% to 213% depending on the role and the skills it requires (Boushey and Glynn, 2012). And there’s a detail that matters more than the figure itself: only 2 of the 11 studies reviewed included indirect costs, which the authors describe as hidden and hard to determine.
Gallup, using a different methodology, estimates that replacing an employee can cost between one-half and two times their annual salary (McFeely and Wigert, 2019).
The gap between those figures is precisely the part almost nobody counts:
- Overtime for the people covering the position while it’s vacant.
- The hours an experienced operator or a supervisor spends teaching instead of producing.
- Equipment that runs below capacity, or stops, because the person running it hasn’t mastered it yet.
- The errors, rework, and deviations an expert would have avoided.
- The knowledge that walked out the door with the person and was never written down anywhere.
Almost all of that happens during a single period. And that period has a name.
The cost hidden in the curve
During Time to Competency, the organization pays a full salary and receives partial performance.
A simple way to see it, which we acknowledge is a simplification: if someone takes six months to reach the standard and their performance rises more or less evenly from zero, over that period they deliver, on average, half of what’s expected. In other words, the organization lost the equivalent of about three months of full performance, not counting the time of whoever trained them.
The real curve is never a straight line, and someone with prior experience doesn’t start from zero. But the exercise shows something the turnover cost spreadsheet doesn’t: the longer the TTC, the more expensive each departure, because every person who leaves forces you to pay for the curve all over again.
TTC is not a constant
Many organizations plan onboarding as if reaching the standard simply “takes what it takes” and all you can do is wait. Research on learning curves suggests otherwise.
Lapré (2011) shows that the rate of learning varies widely across industries, across companies within the same industry, and even across units within the same company, and that it should therefore be treated as a variable management can influence, not as a given. The studies he reviews point to three concrete practices:
- Stable teams, where people learn who is good at what and how to work together (Reagans, Argote and Brooks, 2005; Huckman, Staats and Upton, 2009).
- Deliberate routines when introducing something new: formal procedures, team debriefs, and coaching (Pisano, Bohmer and Edmondson, 2001).
- A psychologically safe environment, where flagging a problem and looking for its cause carries no penalty (Tucker, Edmondson and Spear, 2002; Tucker, Nembhard and Edmondson, 2007).
He also cautions that not every improvement effort helps. In one industrial plant, projects that produced both the why and the how accelerated waste reduction, while projects that produced only the why slowed it down (Lapré, Mukherjee and Van Wassenhove, 2000). Understanding isn’t enough: what’s understood has to be turned into a way of working.
It’s worth saying that this evidence comes from hospitals, manufacturing plants, and services, and it measures improvement at the unit level (cost, quality, waste), not how long it takes an individual. It’s a signal about what matters, not a measurement of TTC in mining. But if TTC depends on these practices, measuring it stops being a diagnostic exercise and becomes a way to know whether those practices are working.
When the two numbers multiply
This is the central point of the article.
Turnover tells you how many new people come in each year to replace those who leave. TTC tells you how long each of them spends below the standard. Multiply them and you get a third number that almost nobody calculates:
Share of the workforce below standard on any given day ≈ annual turnover × TTC (in years)
With a TTC of 8 months (two-thirds of a year), for example:
| Annual turnover | Workforce below standard on any given day |
|---|---|
| 5% | ~3% |
| 18% | ~12% |
| 60% | ~40% |
| 100% | ~67% |
At 5% turnover, TTC barely registers: three in a hundred people are still learning. At 60%, it’s four in ten. Same operation, same equipment, same training program, but a crew that is, in practice, permanently in training.
This is an approximation: it assumes a stable headcount and that people stay at least as long as their TTC. When many leave earlier, the number goes down, but the cost goes up, because the organization paid for the curve and never got a competent person out of it.
There’s a variation on this that we see often in mining. A site that trains its operators very well becomes, without meaning to, a school for the rest of the industry: it pays for the entire learning curve, and another operation hires the person once they’re competent. The problem isn’t that the training is bad. It’s that it’s good, and the system isn’t designed to keep what it produces.
And there’s a second-order effect. When turnover is high, the most experienced people spend a growing share of their time teaching, covering, and correcting. That wears them down, and when they leave, the organization doesn’t lose one person: it loses the person who was holding up everyone else’s learning curve.
The cost you can’t measure in dollars
In industrial operations, there’s one more reason to watch these two metrics, and it’s the most important one.
Breslin and Smith (2006), of the Institute for Work & Health in Ontario, studied the relationship between job tenure and workplace injuries. They found that workers in their first month on the job had more than four times the risk of a lost-time injury compared with those who had been in their job for more than a year. The effect held across all age groups and was stronger among men, in manual work, and in goods-producing industries.
The study isn’t from mining or from Chile, and that should be said. But the mechanism doesn’t depend on the country: someone who hasn’t yet mastered their task has less room to recognize an abnormal condition in time.
If that’s true, the table above isn’t just a cost table. It’s also the share of the workforce that is in its highest-risk period. For those of us who work in HSEC, that number belongs on the same dashboard as the injury rates.
Why almost nobody measures them
It isn’t carelessness. Turnover lives in one department and its cost in another: the number of departures sits with HR, while the cost shows up scattered across the operating budget as overtime, maintenance, and lost productivity. The average hides the problem, because an acceptable overall rate can coexist with a role, a shift, or a supervisor where people don’t last. Contractors usually fall outside the count, even though their workers operate on the owner’s site, with its risks. And TTC requires something first: to measure when someone arrived, you have to have defined where they were supposed to arrive.
What to do about it on Monday
Five steps that don’t require a new system or additional budget:
- Calculate turnover for one critical role. Just one. The last 12 months, separating voluntary from involuntary, and noting how many departures happened before the one-year mark. Compare it with your operation’s overall turnover: the gap between the two usually tells you more than any outside benchmark.
- Write down what “competent” means in that role. Five to eight observable behaviors, and who validates that they’re met. It’s not a job description: it’s the definition of arrival.
- Reconstruct the TTC of your last ten hires. With the records you already have (start date, certification date, the date they began operating without a buddy), you can get a first estimate in an afternoon.
- Multiply the two numbers. The role’s annual turnover times TTC in years. That percentage, the share of your workforce that is below standard right now, is the one to bring to the leadership meeting.
- Talk to people before it’s too late. According to Gallup, 52% of employees who quit say their manager or organization could have done something to prevent it, and 51% say no one talked with them about their satisfaction or future in the three months before they left (McFeely and Wigert, 2019). A structured conversation at month one, month three, and month six costs very little compared with a departure.
If you’re only going to start with one thing, start with step two. Without a definition of competency, the rest of the numbers have nothing to be measured against.
Where this applies less
Not all turnover is bad. Some departures are good for the organization: people who weren’t a fit for the role, or renewal in teams that had gone too long without change. The goal isn’t zero turnover; it’s knowing what turnover you have, in which roles, and why.
The overlap matters most where TTC is long. In roles that can be learned in a few weeks, turnover costs less. For heavy equipment operators, maintenance technicians, control room specialists, and supervisors, where the curve is measured in months, the effect is much greater.
The cost figures we cite come from other contexts, mainly the United States. We don’t know of a public, verifiable study that has measured the cost of turnover in Chilean mining, so we won’t put a number on it. What is documented is the mechanism, and every organization can calculate its own with its own data.
The question
This article opened with two questions that almost never get an answer. It closes with one that brings them together:
What share of your workforce is below standard today, right now?
You can answer that question with data you already have. And once you do, turnover stops being an HR metric and becomes what it always was: an operations metric.
Sources
- Boushey, H. and Glynn, S. J. (2012). “There Are Significant Business Costs to Replacing Employees.” Center for American Progress, November 16, 2012.
- Breslin, F. C. and Smith, P. (2006). “Trial by fire: a multivariate examination of the relation between job tenure and work injuries.” Occupational and Environmental Medicine, 63(1), 27–32.
- Huckman, R. S., Staats, B. R. and Upton, D. M. (2009). “Team familiarity, role experience, and performance: Evidence from Indian software services.” Management Science, 55(1), 85–100.
- Lapré, M. A. (2011). “Inside the learning curve: Opening the black box of the learning curve.” In M. Y. Jaber (Ed.), Learning Curves: Theory, Models, and Applications (pp. 23–36). CRC Press.
- Lapré, M. A., Mukherjee, A. S. and Van Wassenhove, L. N. (2000). “Behind the learning curve: Linking learning activities to waste reduction.” Management Science, 46(5), 597–611.
- McFeely, S. and Wigert, B. (2019). “This Fixable Problem Costs U.S. Businesses $1 Trillion.” Gallup Workplace.
- Pisano, G. P., Bohmer, R. M. J. and Edmondson, A. C. (2001). “Organizational differences in rates of learning: Evidence from the adoption of minimally invasive cardiac surgery.” Management Science, 47(6), 752–768.
- Reagans, R., Argote, L. and Brooks, D. (2005). “Individual experience and experience working together: Predicting learning rates from knowing who knows what and knowing how to work together.” Management Science, 51(6), 869–881.
- Tucker, A. L., Edmondson, A. C. and Spear, S. (2002). “When problem solving prevents organizational learning.” Journal of Organizational Change Management, 15(2), 122–137.
- Tucker, A. L., Nembhard, I. M. and Edmondson, A. C. (2007). “Implementing new practices: An empirical study of organizational learning in hospital intensive care units.” Management Science, 53(6), 894–907.
Think4Change works with industrial organizations on hiring, onboarding, and developing people, so they reach the standard sooner and stay there longer. From experience to creation and value.